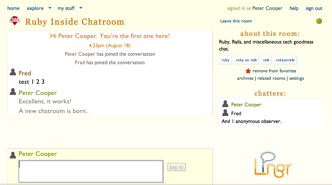
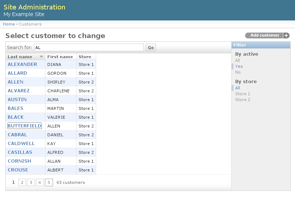
Alex Bradbury has developed Ariel, a library that uses predefined examples to work out how to extract information from other documents. It was a Google Summer of Code project and was mentioned by Austin Ziegler. More directly from Alex:
Ariel is a library that allows you to extract information from semi-structured documents (such as websites). It is different to existing tools because rather than expecting the developer to write rules to extract the desired information, Ariel will use a small number of labeled examples to generate and learn effective extraction rules. It is developed by Alex Bradbury and released under the MIT license. Read More

